
November 19, 2019

If you look around sports organizations today, it may look slightly different than what was in place just 20-30 years ago. The biggest difference today is that it’s common to have entire departments dedicated to collecting data and metrics with the goal of improving the health and performance of the athletes. The problem is that even though we are collecting more data than ever, injuries have only gone up and remain at an all-time high. The solution then, can’t be collecting more data. The solution is having better insight.
Just look at elbow injuries in the MLB. Between 1974 and 2015 there were a total of 400 UCL surgeries performed on players and nearly one third (131) of all of those procedures occurred from 2011-2015. It is very clear that even with more data than ever injury rates continue to rise and teams continue to spend a significant amount of money on players on the bench. That’s just one type of injury. What about others?

Today, teams collect an overwhelming amount of data each season ranging from heart rate variability (HRV), sleep, global positioning systems (GPS), DEXA scans, ground reaction force, etc. However, injuries numbers are still skyrocketing. While there are many theories as to why (early specialization, more games throughout the calendar year), another theory is that we tend to look at metrics in isolation without regard for how they impact other variables.
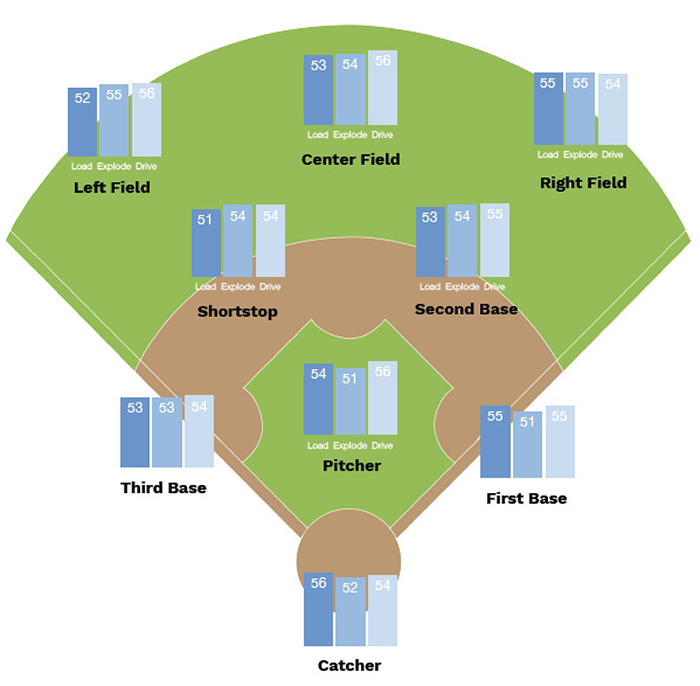
For example, when looking at the Jump Scan we look at three meaningful variables (Load/Explode/Drive), but what’s most telling is not the magnitude of the variables, but rather the relationship with each other. Low Load is often a problem if Explode and Drive are much higher (>15 T-Scores), but if the relationship with the others is about the same it’s much less of a risk.
If you consistently collect force plate data of about 150 variables it can be easy to look at specific metrics in isolation. For example, some want to look into Eccentric Rate of Force (Load) because it can often tell you the decelerative ability of an individual. While this may be helpful, it is also worth noting this metric in relation to Relative Concentric Impulse (Drive) and the impact it has on force production.
At Sparta, we have seen the Load/Drive relationship important in how pitchers sequence, especially later in the season. When Load dips and Drive gets higher the athlete is spending much more time on the ground to accomplish the same job. In theory, if the rate of force goes down (Load), more momentum (Drive) must be created to throw the same velocity – only now it has much more impact on ligaments. Relationships matter.
At the end of the day, we cannot be buried in data points. We should seek to collect much more depth of meaningful variables and much less width in order to gain a clearer vision. Collecting one metric frequently that provides insight is always going to be much more valuable than collecting 100 metrics that sit on your desk.